Brief & response
An information design brief, to explore & understand the filtering, use & explanation of complex data to an audience. 'You are required to select an area of study & endeavour to inform, explain, clarify & enlighten.'
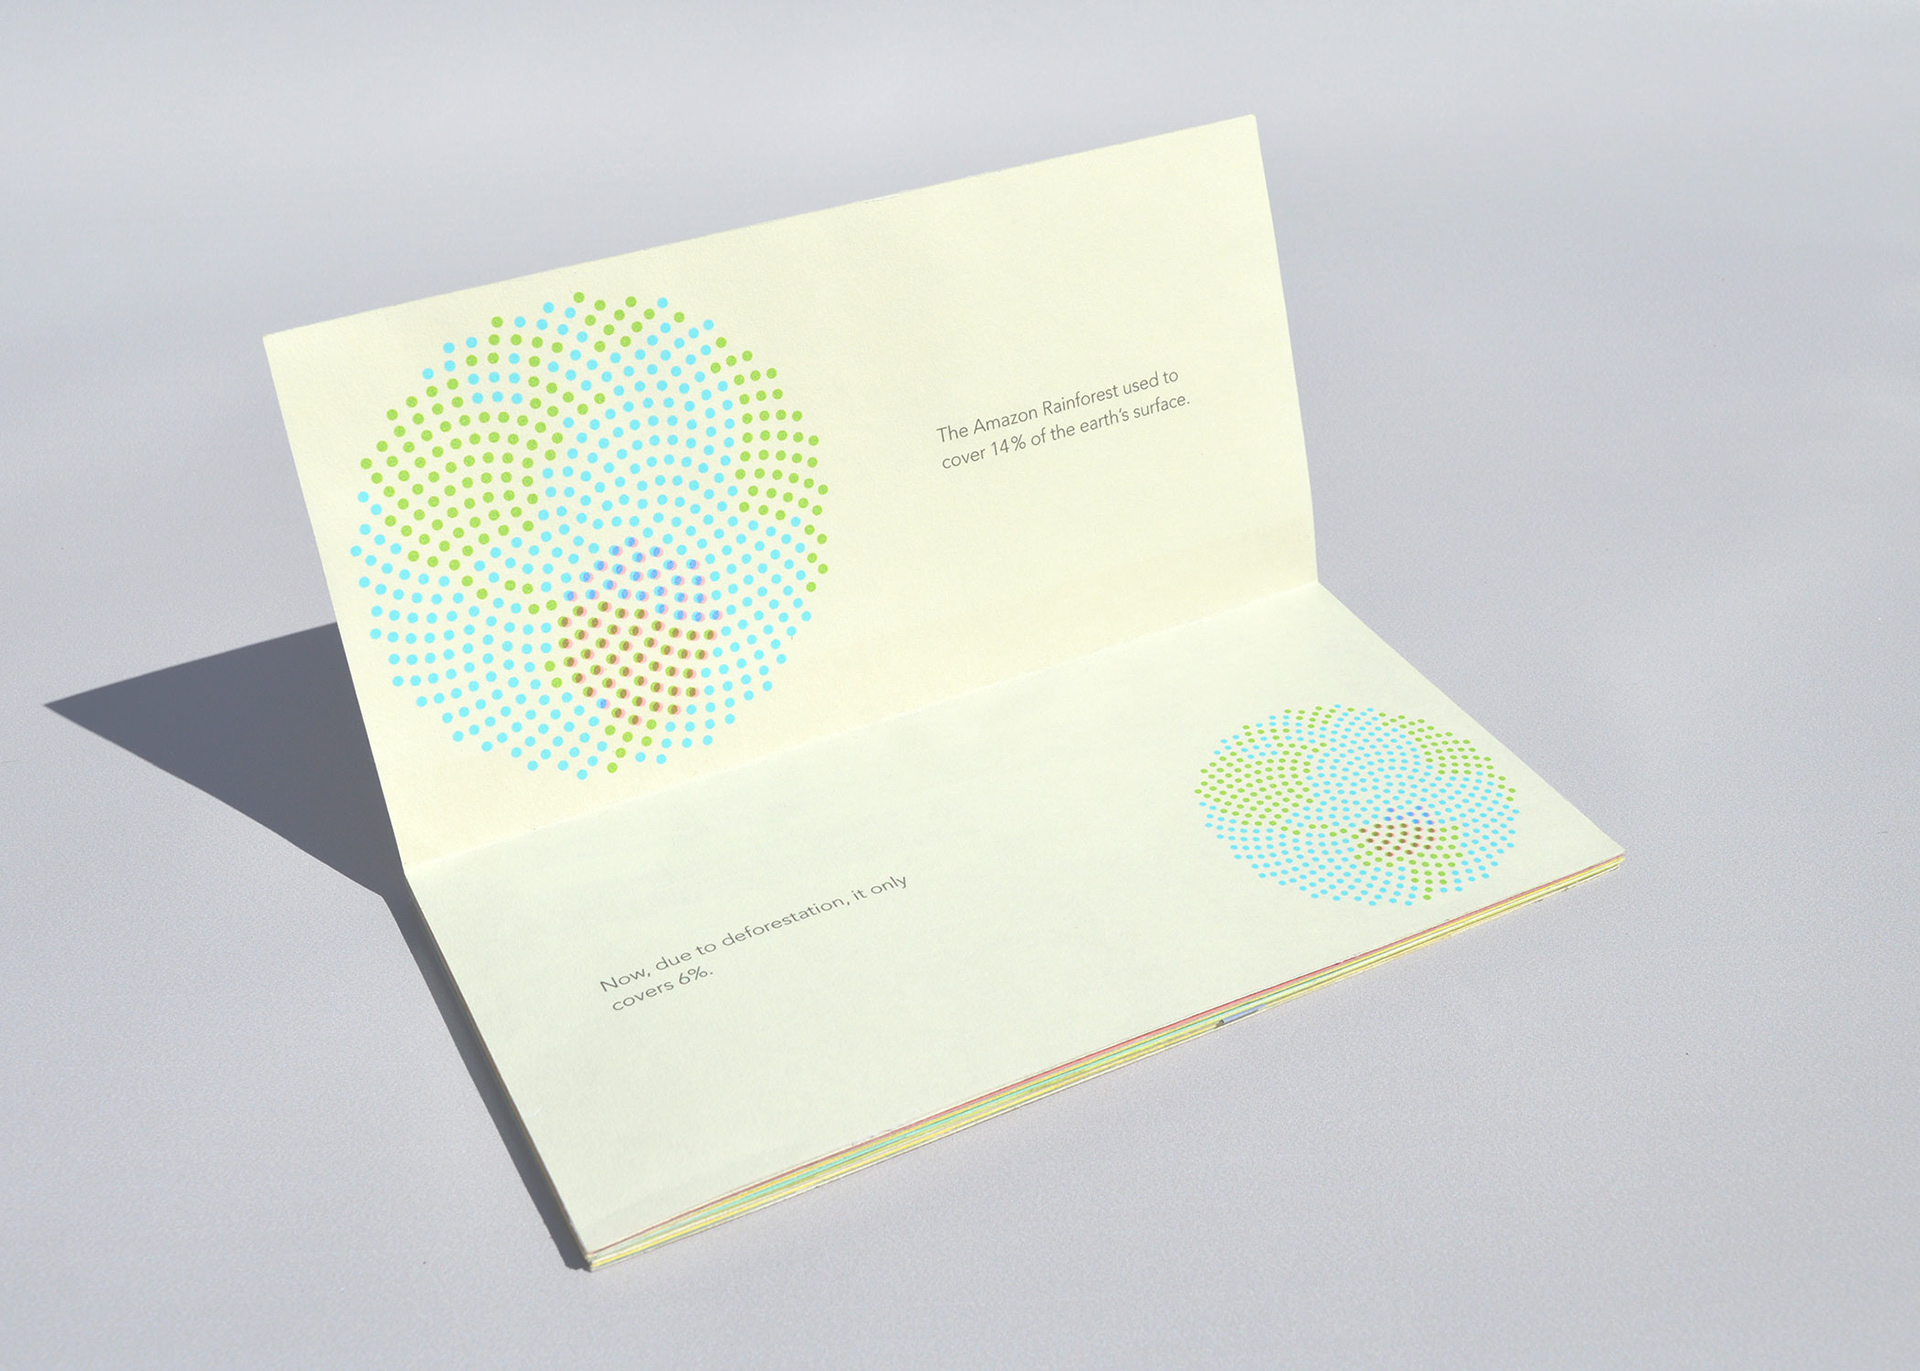
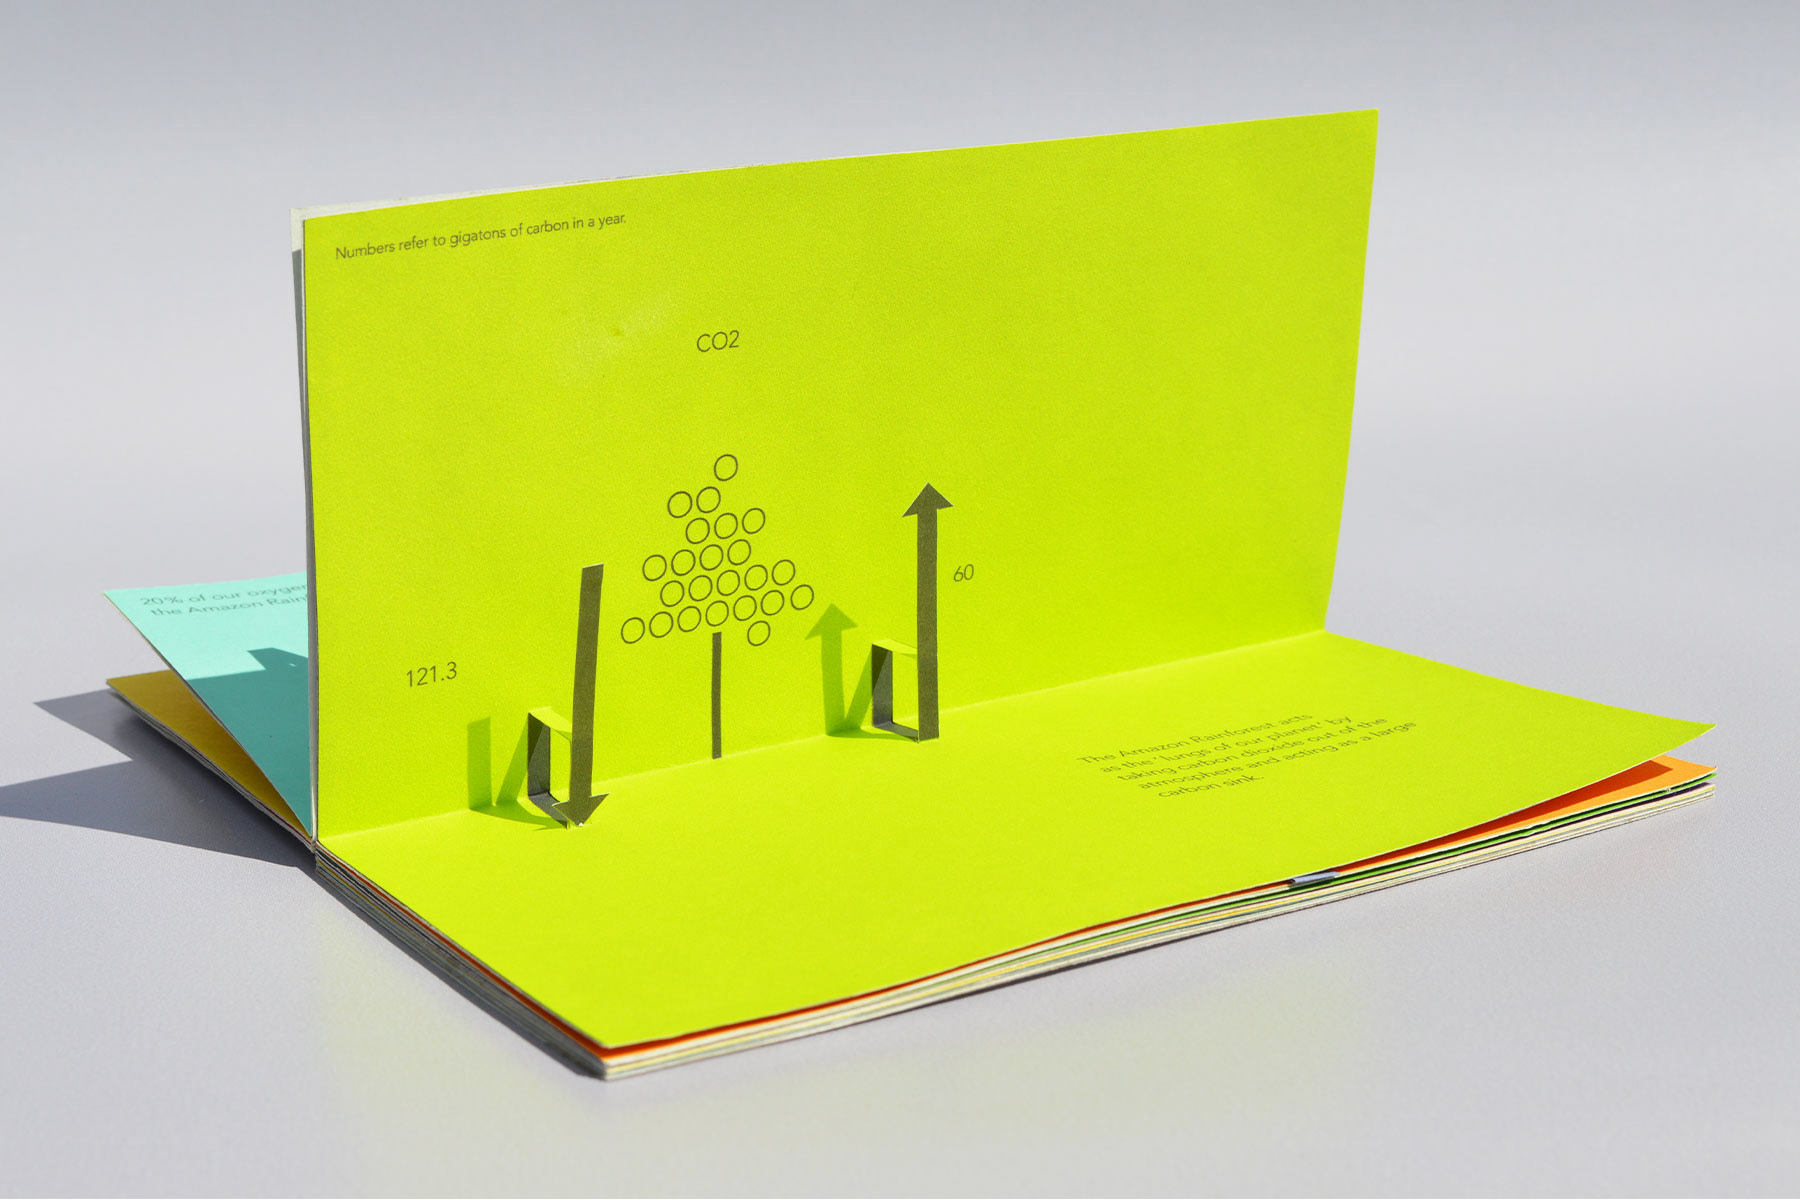
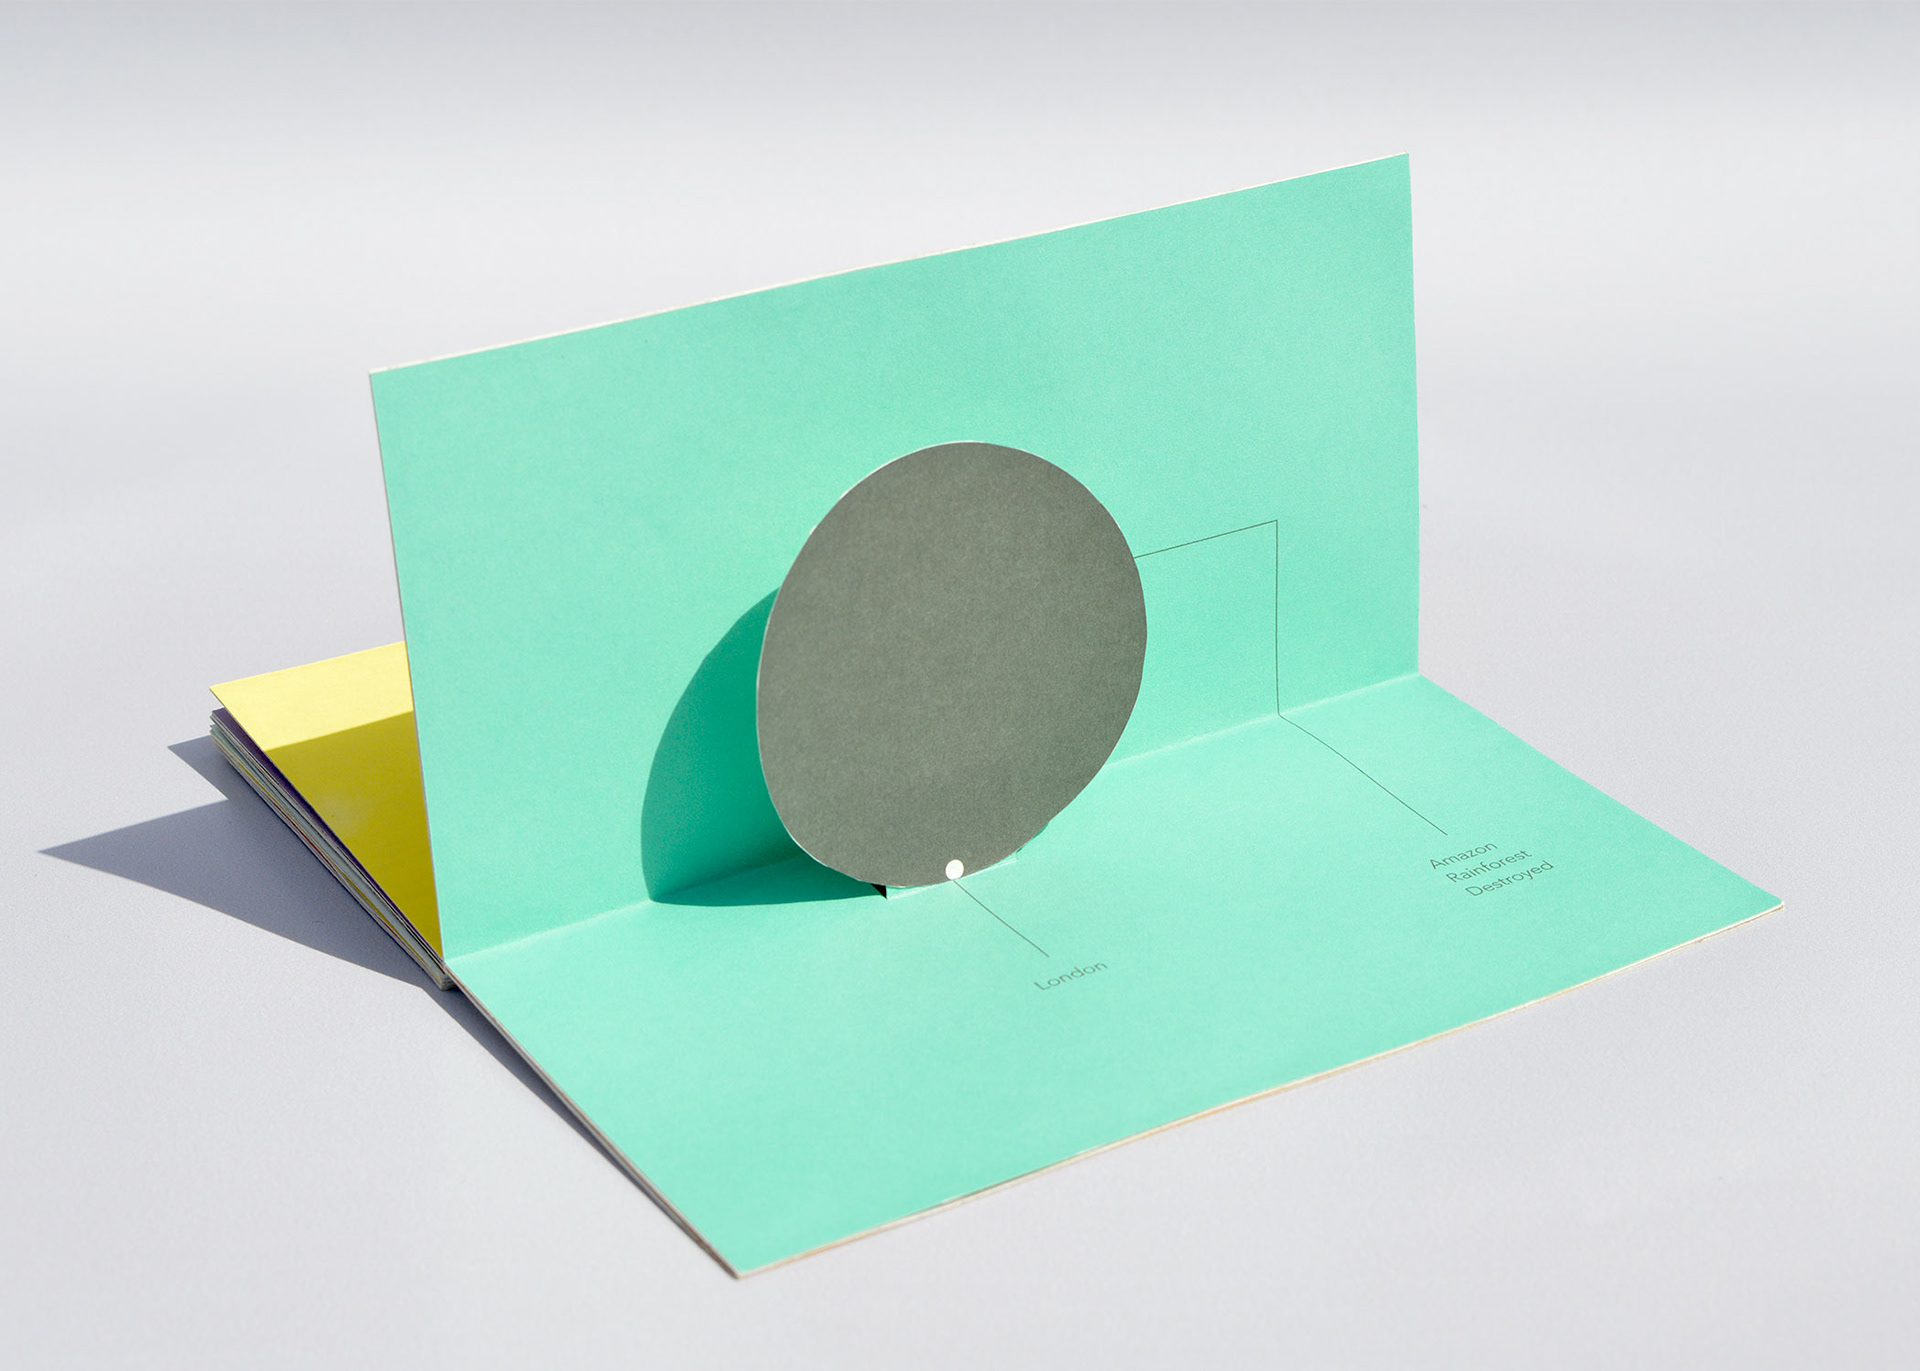
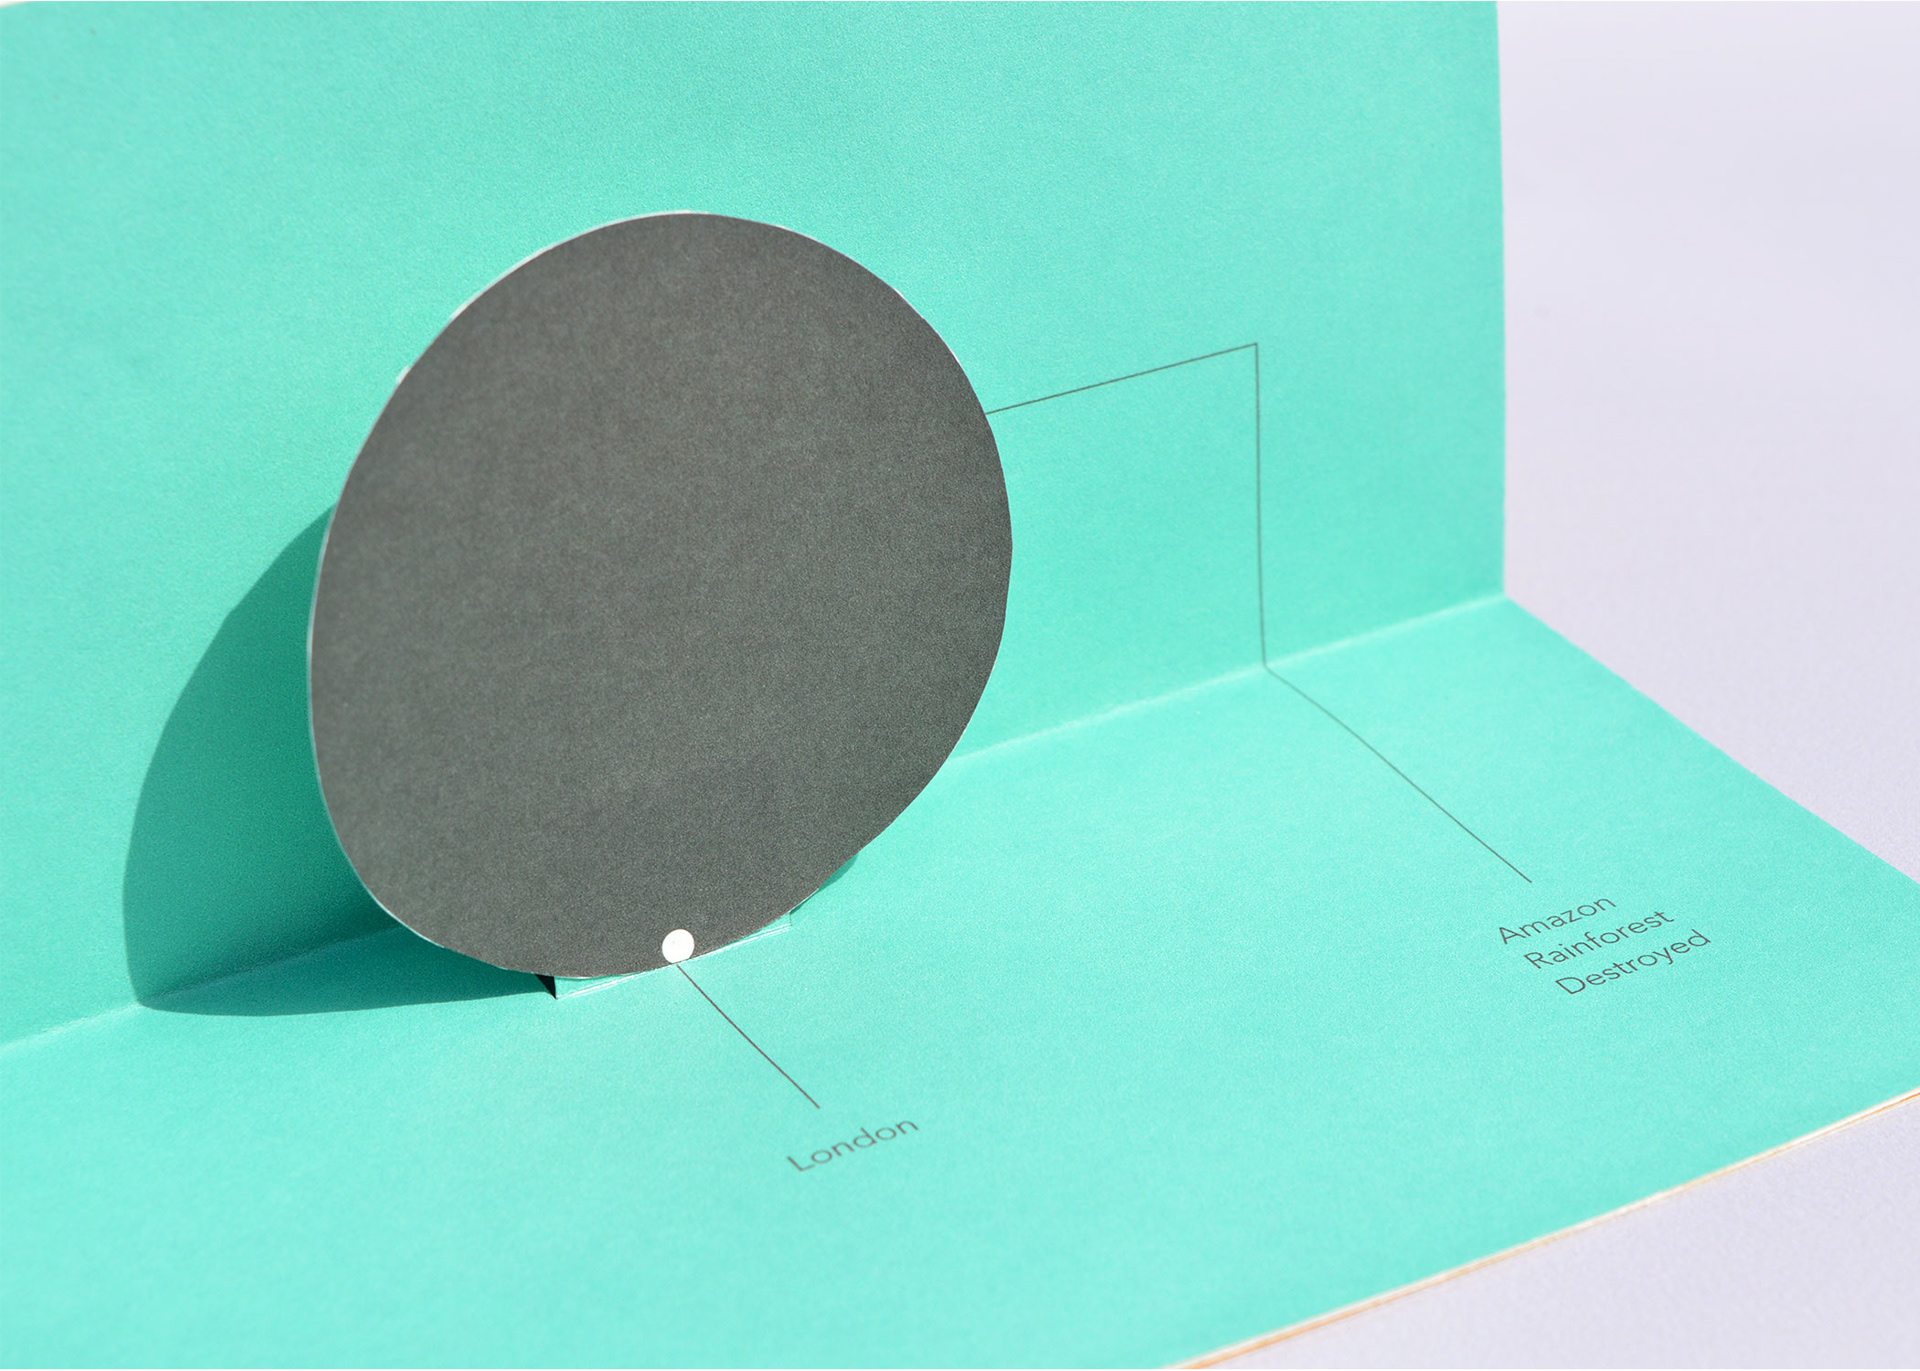
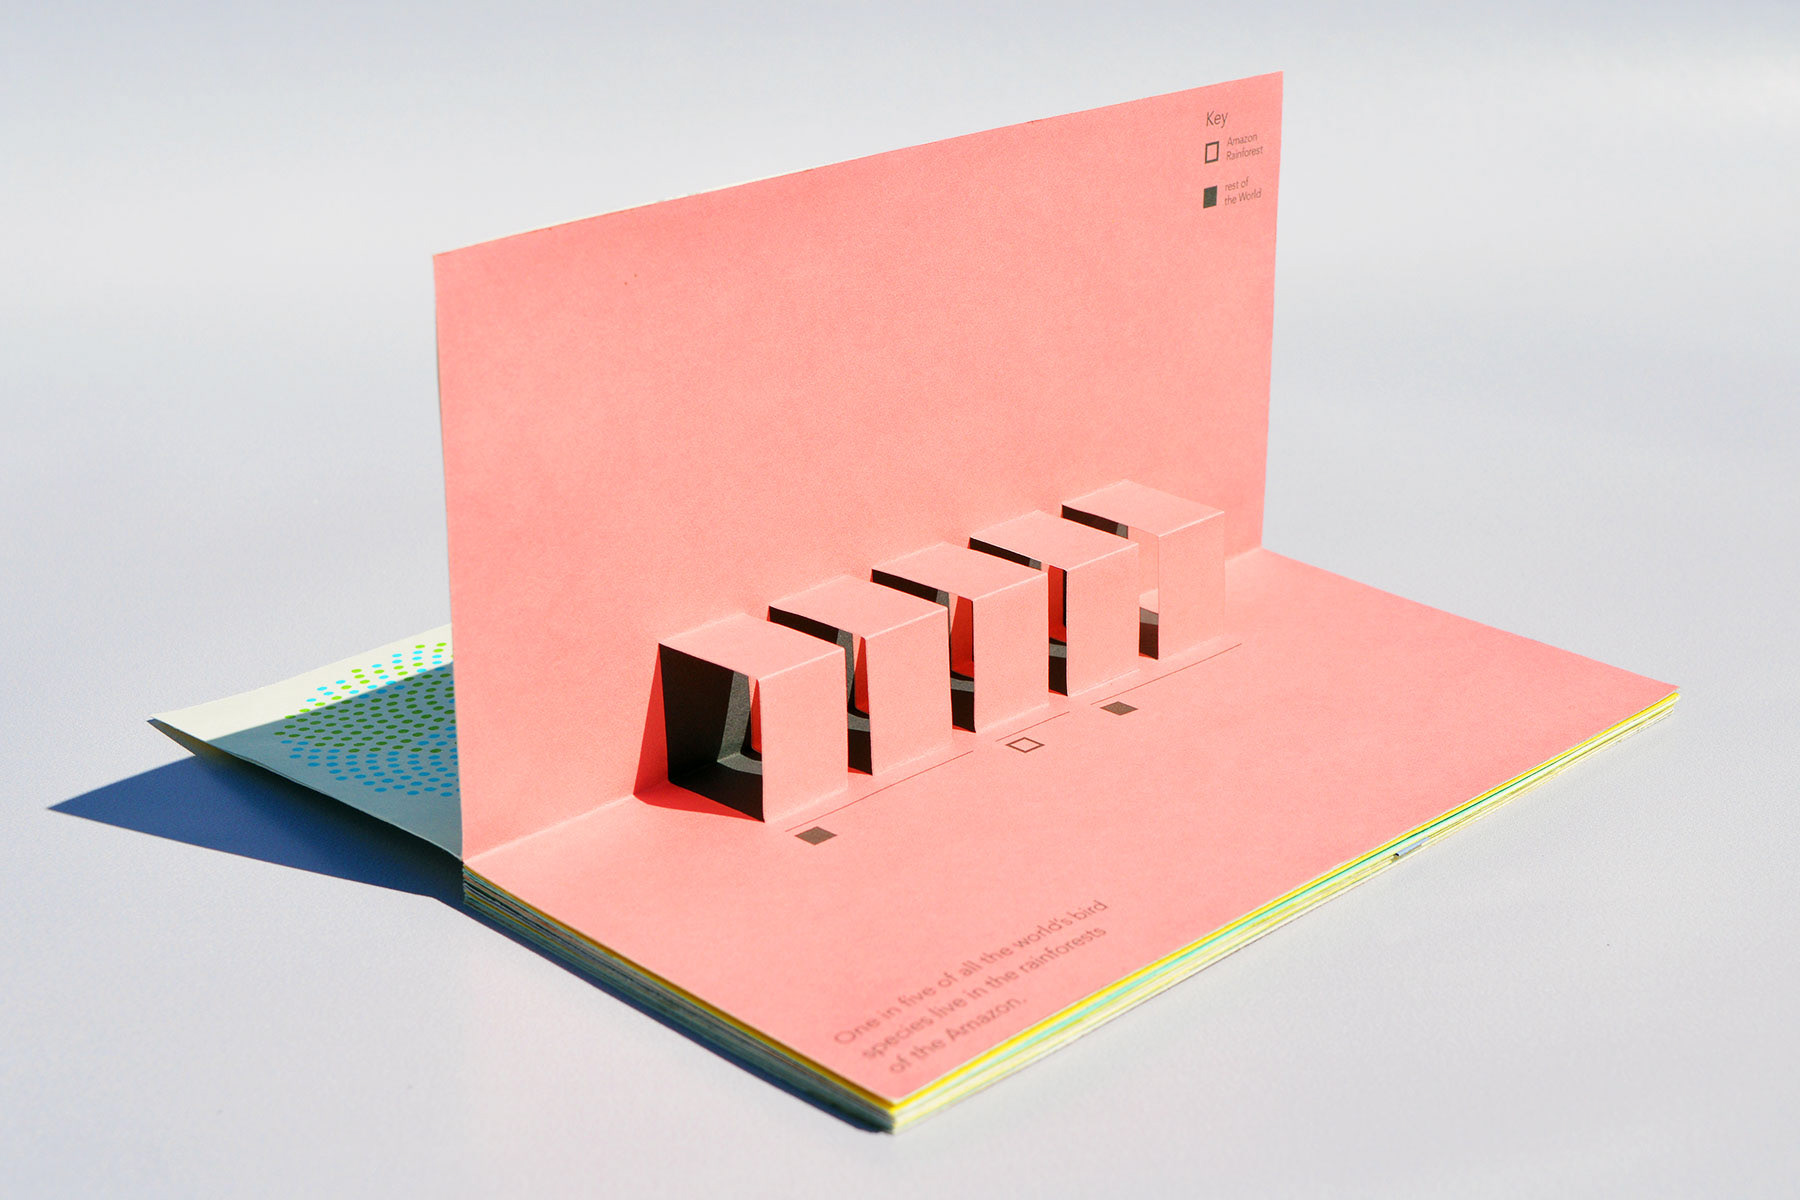
I decided to focus on climate change & found large complex data sets about deforestation in the Amazon Rainforest. Although the data sounded shocking, I thought this alone would not work to give the audience a proper understanding. To make the data more understandable, I created visual comparisons & visualised the data so readers could see the huge scale of deforestation. As an example, some pages visualise the area of countries against the area of rainforest lost to help the reader comprehend the huge area that has been lost. These were displayed as simple as possible to make this easy to understand for readers & to really focus on the devastating impact of deforestation.
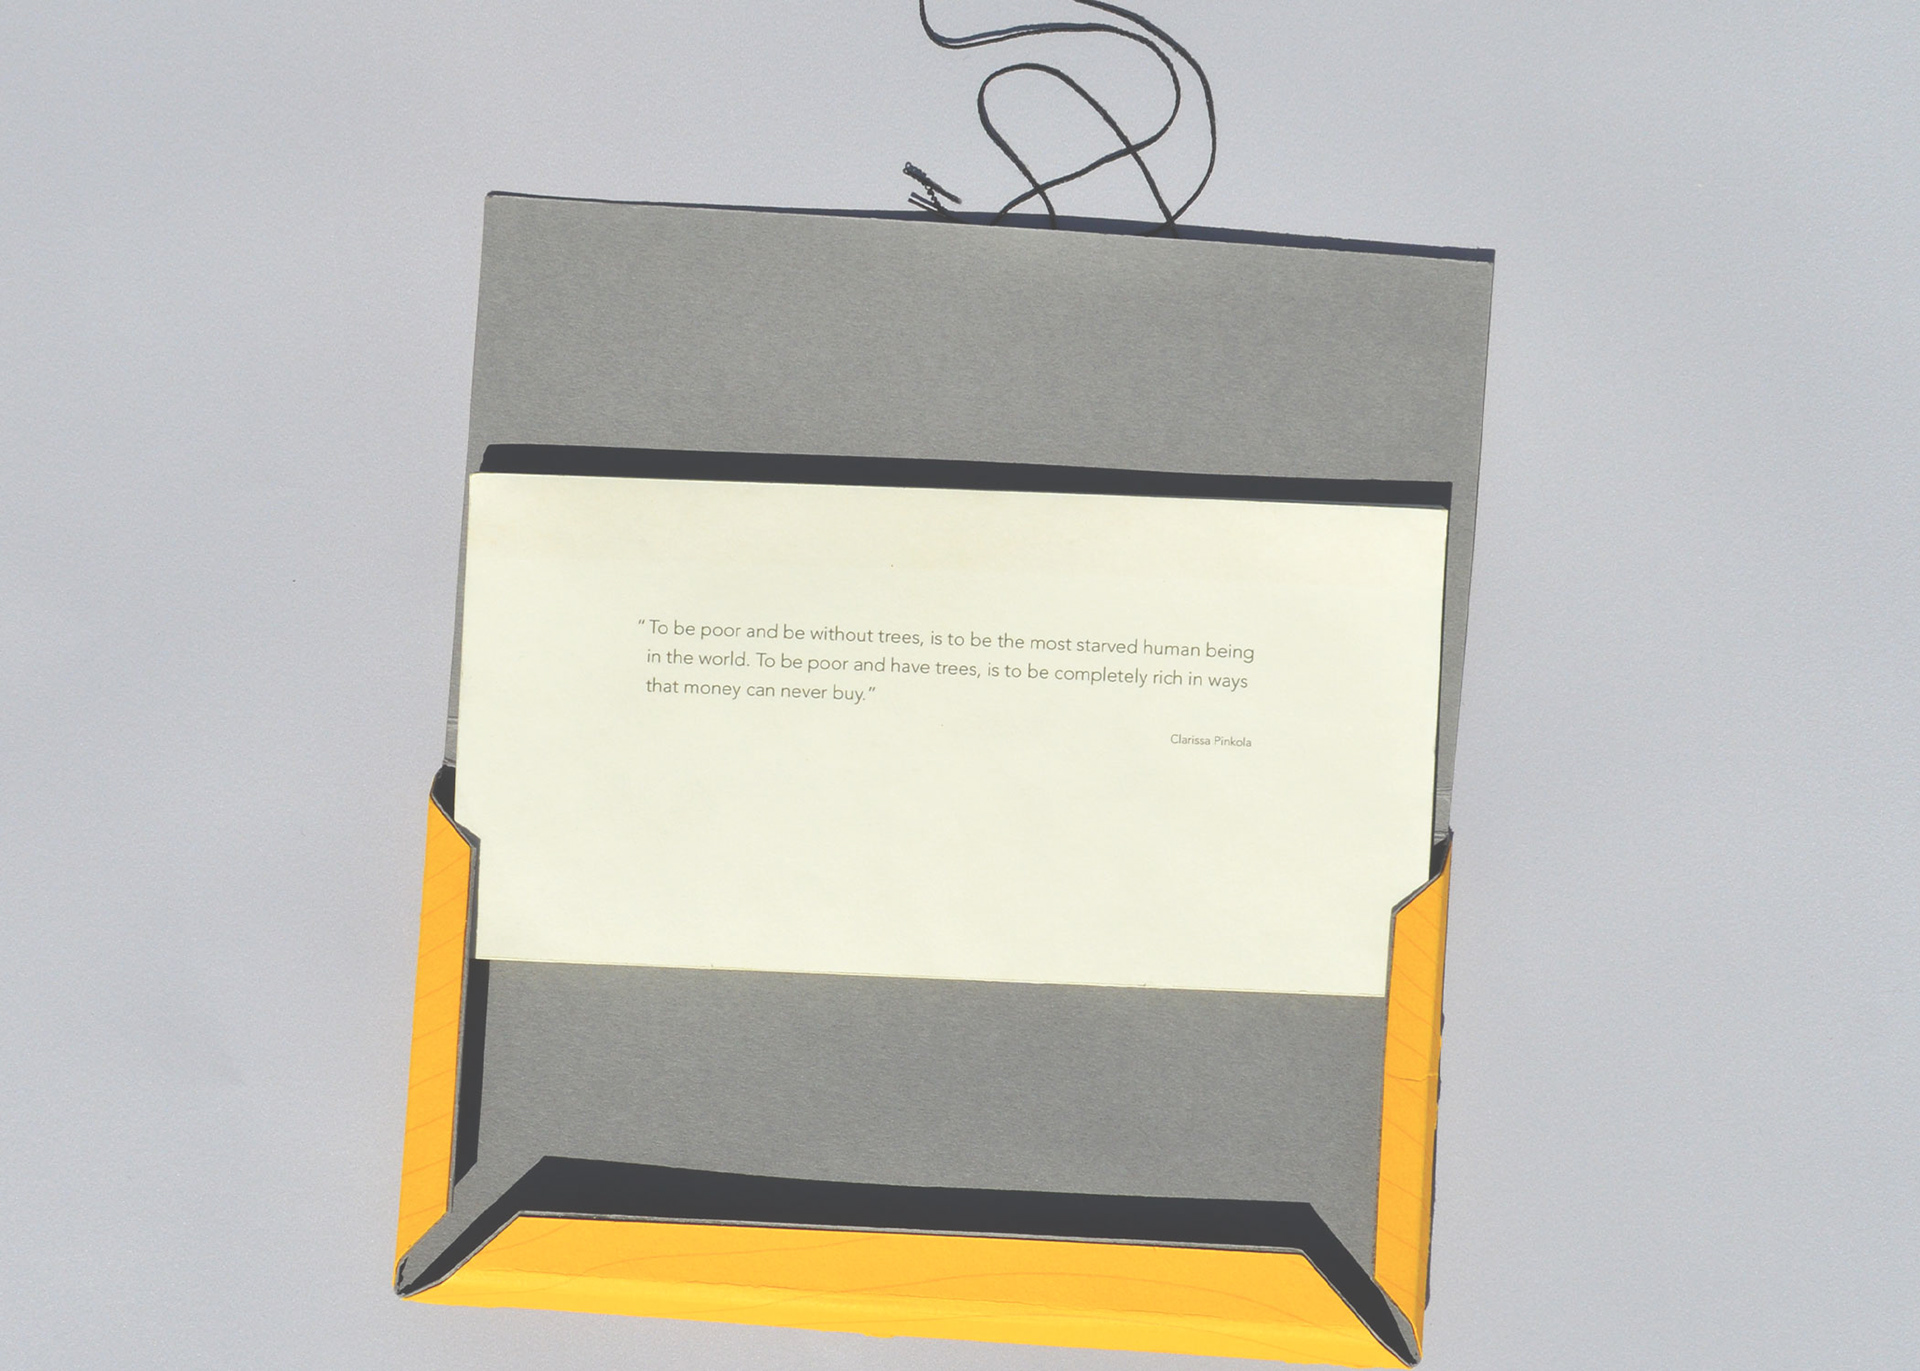
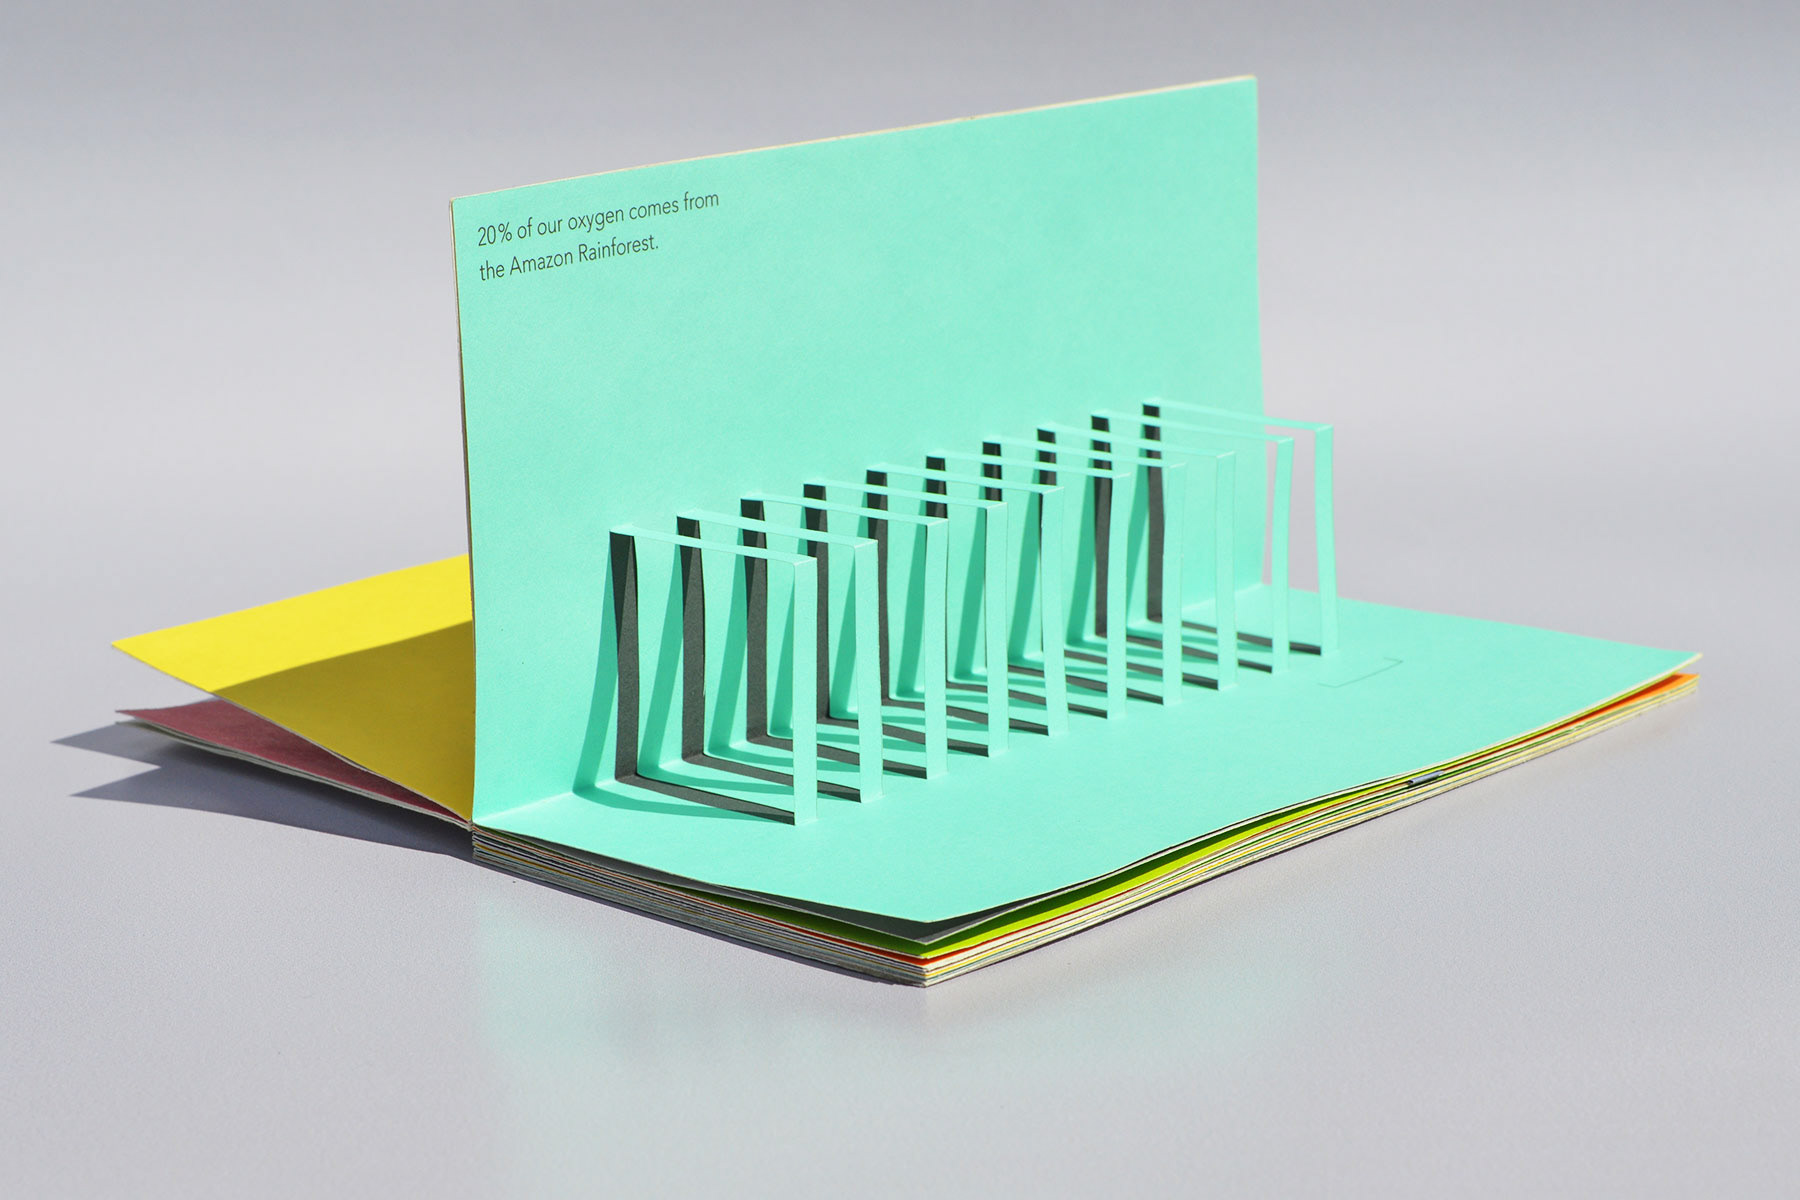
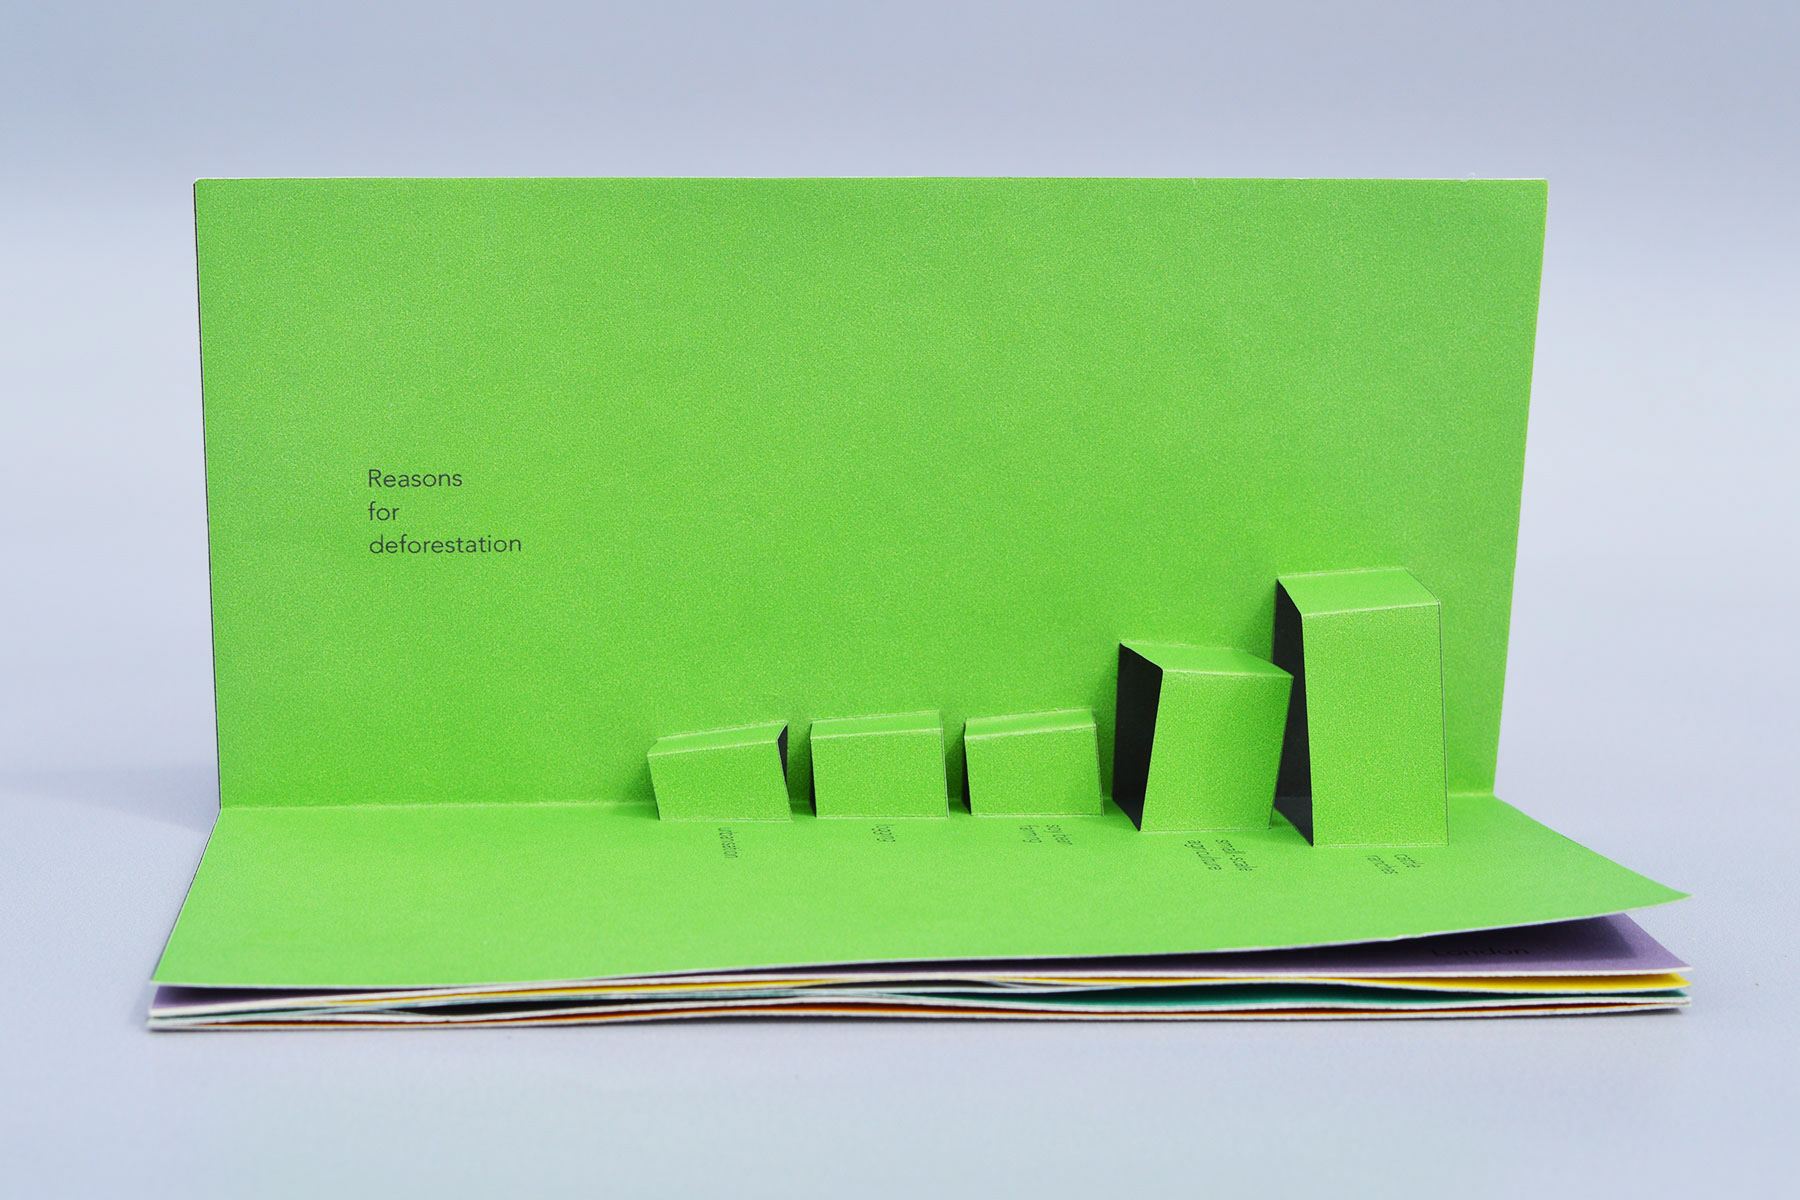
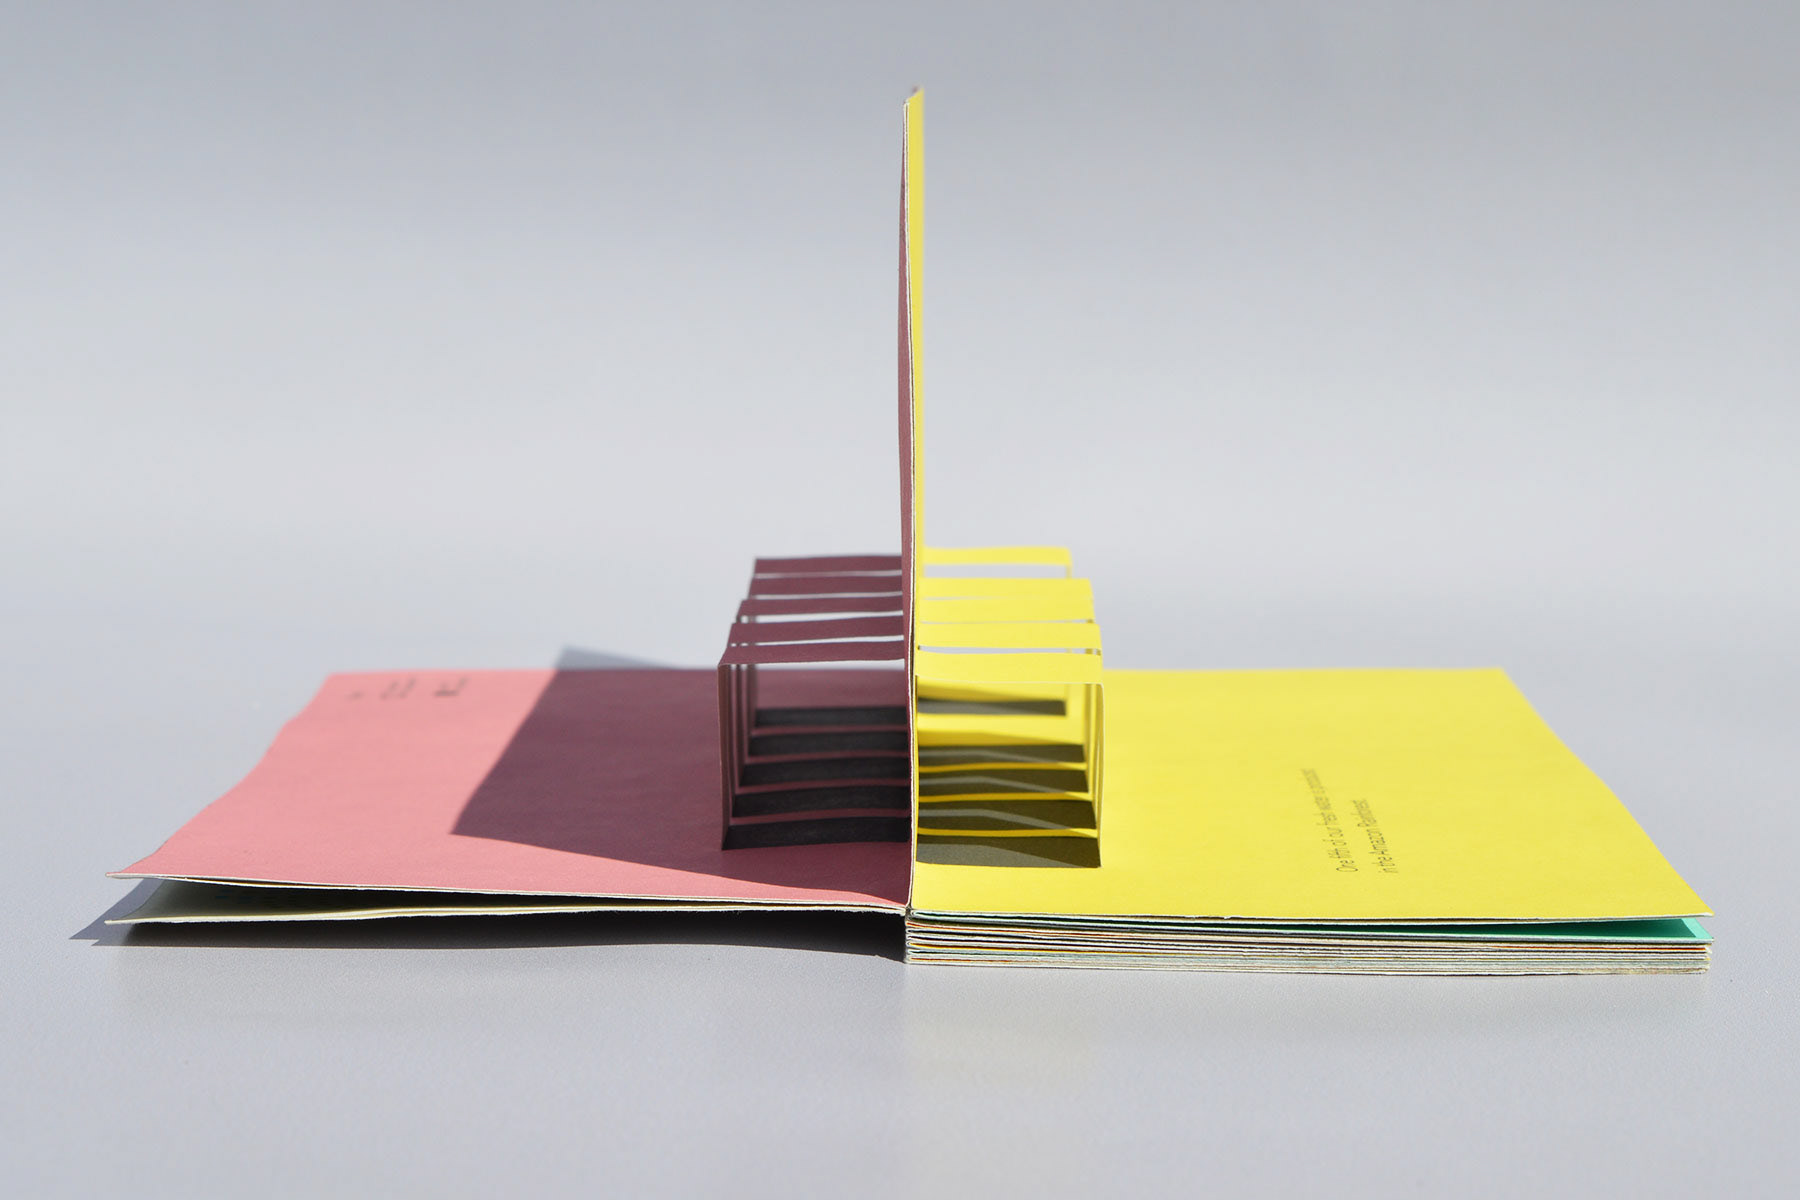
I chose to design this as a 3D pop-up book that would cast shadows just like trees to make the data look & feel more tangible rather than just being a flat graphic.
